ESRI ArcMap was used for all the analyses for this project. Below is the model used to run the analysis. It was built using the model builder tool.
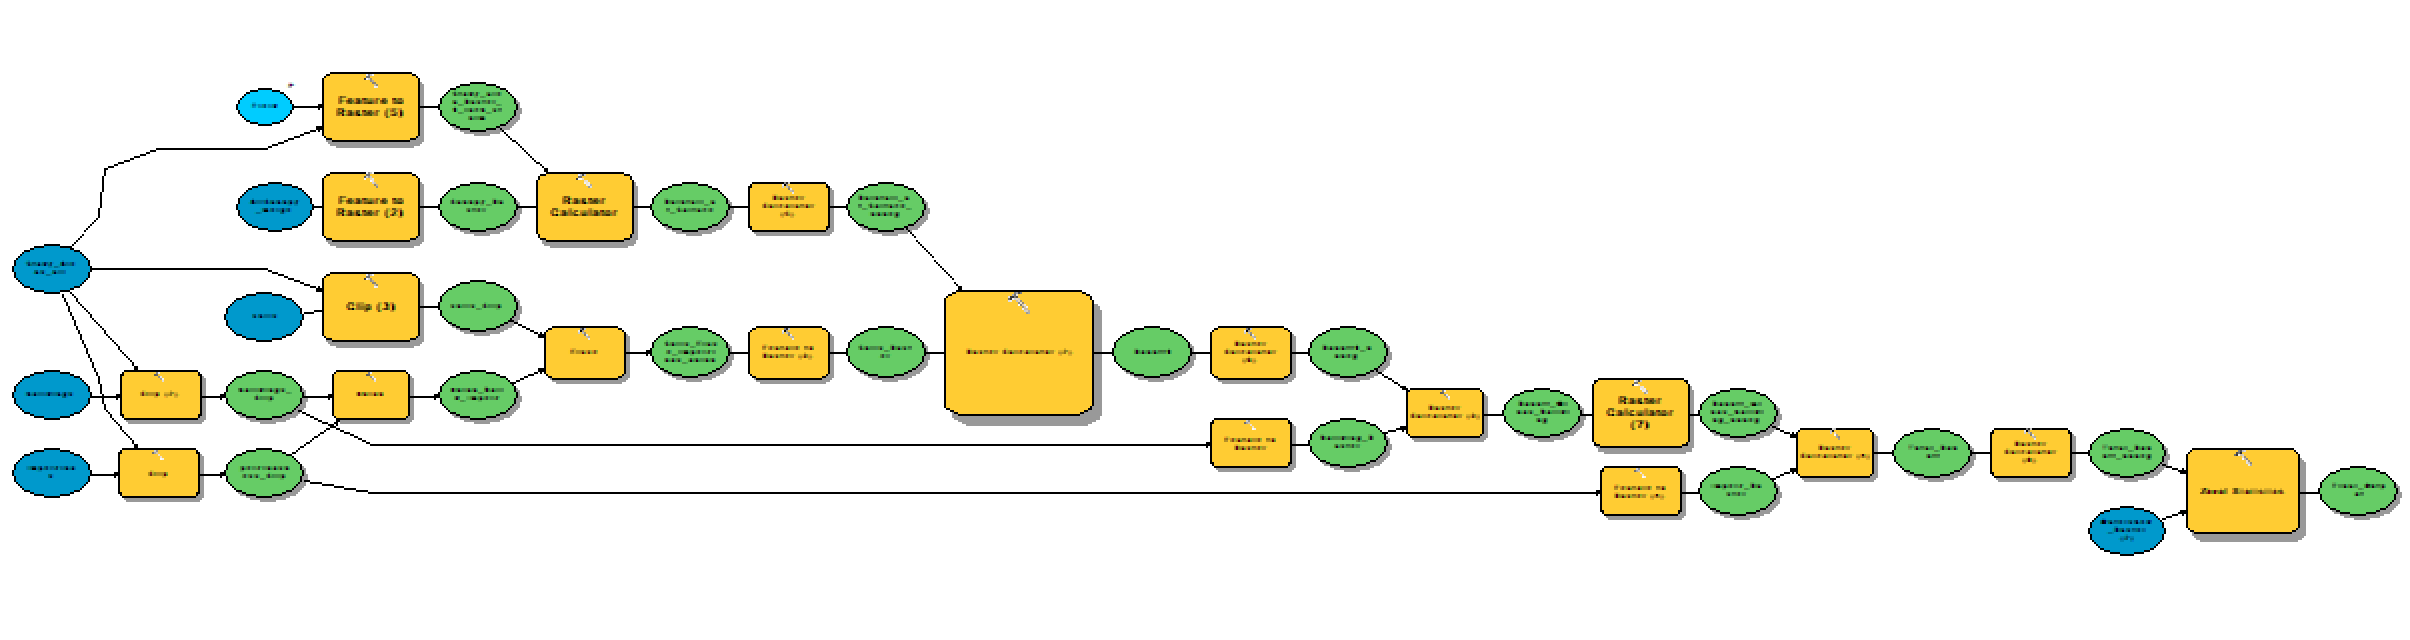
The blue circles represent the original layers. The yellow squares are analysis functions, and the green circles are the outputs. The original features are input and clipped to the study area. The canopy and storm level are converted to rasters to be able to calculate the rainfall at surface. Meanwhile the buildings and impervious surfaces are unioned and erased from the soils. Runoff is calculated via the raster calculator from the rainfall and soils layers. The buildings and impervious surfaces are subtracted to just limit the runoff to the soils layer. Runoff is then aggregated by watershed.
Soil:
Vegetation:
Surface Sinks:
Green Roofs:
Underground Storage: